


03383AGILE GROUP
0.4800.015+3.23%6.45M3.09M0.4700.4650.4900.4652.42B2.42B5.05B5.05B+5.49%+12.94%-12.73%-21.31%-42.86%+11.63%-35.14%--0.13%LossLoss5.38%Real Estate Developers
01638KAISA GROUP
0.1740.003+1.75%1.19M203.56K0.1710.1710.1740.1681.22B1.22B7.02B7.02B+12.99%+21.68%-10.77%-2.79%-35.56%+100.00%-12.12%--0.02%LossLoss3.51%Real Estate Developers
02202CHINA VANKE
5.8800.090+1.55%38.78M225.52M5.7805.7905.9405.64070.15B12.97B11.93B2.21B+5.19%+12.00%+2.62%+11.79%-16.95%+51.94%+11.15%--1.76%LossLoss5.18%Real Estate Developers
00604SHENZHEN INVEST
0.7700.010+1.32%1.43M1.09M0.7700.7600.7800.7506.85B6.85B8.90B8.90B+2.67%+10.00%-8.33%-3.75%-18.09%-10.47%-11.49%9.09%0.02%LossLoss3.95%Real Estate Developers
02039CIMC
4.9300.030+0.61%2.27M11.14M4.9604.9005.0004.82026.59B15.23B5.39B3.09B+4.01%+9.07%-19.58%-0.80%-16.01%-29.93%-8.87%0.49%0.07%8.298.293.67%Commercial Vehicles
00895DONGJIANG ENV
1.8800.010+0.53%14.42M27.24M1.8901.8701.9301.8402.08B376.26M1.11B200.14M+10.59%+13.94%-2.08%+11.90%-12.15%+13.94%+1.62%--7.21%LossLoss4.81%Environmental Services
01330DYNAGREEN ENV
3.9900.020+0.50%2.29M9.14M3.9703.9704.0103.9505.56B1.61B1.39B404.36M+1.79%+6.68%+21.28%+20.54%+25.47%+70.14%+11.14%6.89%0.57%8.818.811.51%Environmental Services
02388BOC HONG KONG
30.3000.150+0.50%15.20M458.96M30.00030.15030.35030.000320.36B320.36B10.57B10.57B+1.34%+5.21%+1.68%+22.18%+18.13%+45.78%+21.44%5.66%0.14%8.388.381.16%Banks
00144CHINA MER PORT
12.3800.060+0.49%2.29M28.39M12.40012.32012.50012.28051.97B51.97B4.20B4.20B-1.28%+3.34%-7.34%-3.88%-7.89%+34.13%-10.55%5.90%0.06%6.566.561.79%Shipping & Ports
03968CM BANK
44.3000.150+0.34%8.03M355.00M43.85044.15044.45043.8501.12T203.38B25.22B4.59B+1.49%+6.88%-9.31%+8.05%+11.87%+51.77%+10.75%4.88%0.18%6.976.971.36%Banks
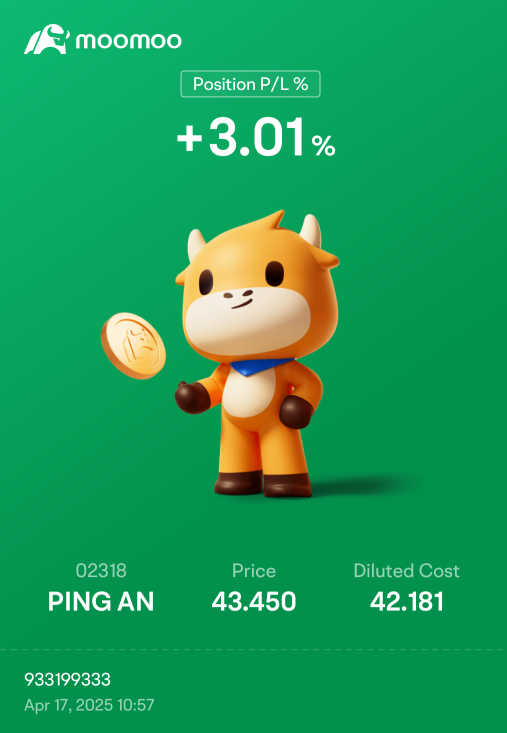
02318PING AN
45.6500.100+0.22%43.43M1.98B45.05045.55045.90045.050831.30B339.98B18.21B7.45B+4.22%+11.07%-5.49%+8.82%-6.74%+67.63%-0.87%5.84%0.58%6.086.081.87%Insurance
03333EVERGRANDE
0.1630.0000.00%0.000.000.0000.1630.0000.0002.15B2.15B13.20B13.20B-12.37%-19.70%-30.64%-19.70%-89.94%-97.19%-30.64%--0.00%LossLoss0.00%Real Estate Developers
03311CHINA STATE CON
10.7000.0000.00%4.67M49.98M10.70010.70010.88010.62056.52B56.52B5.28B5.28B-0.56%+0.75%-1.11%-7.12%-9.78%+33.17%-12.72%5.49%0.09%6.046.042.43%Heavy Infrastructure
00737BAY AREA DEV
1.8300.0000.00%31.00K56.50K1.8301.8301.8401.8005.64B5.64B3.08B3.08B+3.98%+5.78%+3.39%+1.10%-3.17%+23.85%+0.55%11.64%0.00%11.3011.302.19%Railroads & Highways
00560CHU KONG SHIP
0.7600.0000.00%0.000.000.7600.7600.0000.000852.09M852.09M1.12B1.12B-1.30%+7.04%-7.32%0.00%-2.56%+5.56%0.00%9.21%0.00%7.317.310.00%Shipping & Ports
00152SHENZHEN INT'L
7.970-0.020-0.25%1.35M10.72M7.9907.9908.0907.87019.20B19.20B2.41B2.41B+1.92%+11.62%+4.73%+10.24%+19.49%+43.86%+9.93%4.98%0.06%6.696.692.75%Railroads & Highways
03380LOGAN GROUP
0.880-0.010-1.12%10.43M9.21M0.9000.8900.9100.8605.00B5.00B5.69B5.69B+3.53%+11.39%-8.33%-8.33%-12.00%+66.04%-17.76%--0.18%LossLoss5.62%Real Estate Developers
02007COUNTRY GARDEN
0.435-0.005-1.14%36.17M15.84M0.4400.4400.4450.43012.18B12.18B27.99B27.99B+3.57%+10.13%-9.38%-10.31%-41.22%-71.94%-10.31%--0.13%LossLoss3.41%Real Estate Developers
03399YUEYUN TRANS
1.450-0.020-1.36%50.00K72.90K1.4601.4701.4601.4501.16B300.15M799.85M207.00M-2.03%+5.84%-5.84%+9.85%-2.03%+43.28%+11.54%6.07%0.02%4.554.550.68%Travel & Sightseeing
01813KWG GROUP
0.330-0.005-1.49%1.03M345.57K0.3350.3350.3400.3251.13B1.13B3.42B3.42B+6.45%+13.79%-7.04%-4.35%-31.25%+42.24%-17.50%--0.03%LossLoss4.48%Real Estate Developers
00914CONCH CEMENT
22.250-0.350-1.55%5.52M122.79M22.70022.60022.75022.000117.91B28.92B5.30B1.30B-1.11%+2.53%-1.55%+7.75%+0.23%+37.64%+11.92%4.74%0.43%13.5613.563.32%Construction Materials
01313CR BLDG MAT TEC
1.730-0.030-1.70%7.03M12.11M1.7401.7601.7601.70012.08B12.08B6.98B6.98B+1.76%+1.76%-5.98%+18.49%-13.50%+62.59%+8.81%1.50%0.10%52.4252.423.41%Construction Materials
01052YUEXIUTRANSPORT
3.410-0.060-1.73%1.88M6.42M3.4703.4703.4703.4005.71B5.71B1.67B1.67B-0.87%+1.79%-9.55%-5.80%-7.84%-3.67%-11.43%7.92%0.11%8.048.042.02%Railroads & Highways
01233TIMES CHINA
0.228-0.006-2.56%65.00K14.86K0.2340.2340.2340.222479.21M479.21M2.10B2.10B-1.72%+3.64%-10.59%-33.91%-38.38%+52.00%-48.76%--0.00%LossLoss5.13%Real Estate Developers
03883CHINA AOYUAN
0.121-0.004-3.20%5.46M667.52K0.1240.1250.1250.120506.58M506.58M4.19B4.19B-2.42%-3.20%-35.64%-41.26%-64.41%+23.47%-44.50%--0.13%13.4413.444.00%Real Estate Developers
08191HONG WEI ASIA
0.208-0.007-3.26%294.00K61.19K0.2100.2150.2300.20310.95M10.95M52.66M52.66M+12.43%+10.64%-7.14%-11.49%-1.89%-15.79%-1.89%--0.56%LossLoss12.56%Forestry & Timber


104255742 : how many shares do u hv?![[undefined]](https://static.moomoo.com/nnq/emoji/static/image/default/default-black.png?imageMogr2/thumbnail/36x36 "undefined")
Phoon1981 : you bought more or sell low buy high?
933199333 OP : What you think..![[undefined]](https://static.moomoo.com/nnq/emoji/static/image/default/default-black.png?imageMogr2/thumbnail/36x36 "undefined")
MJ火炎焱 : dont know what u are talking about. statement no clear. lol…
933199333 OP : I add only.![[undefined]](https://static.moomoo.com/nnq/emoji/static/image/default/default-black.png?imageMogr2/thumbnail/36x36 "undefined")